According to a survey by Palo Alto Network, in 2023, 53% of organizations moved their workloads to the cloud, and this trend is expected to reach 64% by 2024–2025. Cloud-native monitoring plays a key role in this digital transformation.
As more businesses in various industries rely on the cloud, understanding cloud monitoring and cloud-native monitoring tools becomes even more important. In the article below, join us to explore the concept of cloud monitoring, its components, challenges, success tips, and the best cloud-native observability tools available.
What is cloud-native monitoring?
Cloud-native monitoring equips cloud-native applications to collect, aggregate, and analyze logs, metrics, distributed traces, and other telemetry data. The purpose of using cloud-native observability tools is to better understand the application, check if it’s operating correctly, monitor the system’s health over time, and observe specific events.
Not unlike traditional monitoring, cloud-native monitoring encompasses a set of parameters ranging from disk capacity, memory consumption, and CPU to the accuracy of tasks, security against unauthorized access, storage capacity, and many others. These are basic for performance evaluation, allowing an operator to take immediate remedial measures if something goes wrong.
Yet, the significant difference with cloud-native monitoring is that monitoring systems must handle temporary objects created and destroyed regularly, besides dealing with distributed applications composed of many independent components.
Key components of Cloud-native monitoring
To monitor and assess the behavior of cloud-native applications, cloud-native monitoring relies on four key pillars for data collection. The data gathered from these pillars is used to evaluate systems and applications as they evolve and grow in complexity.
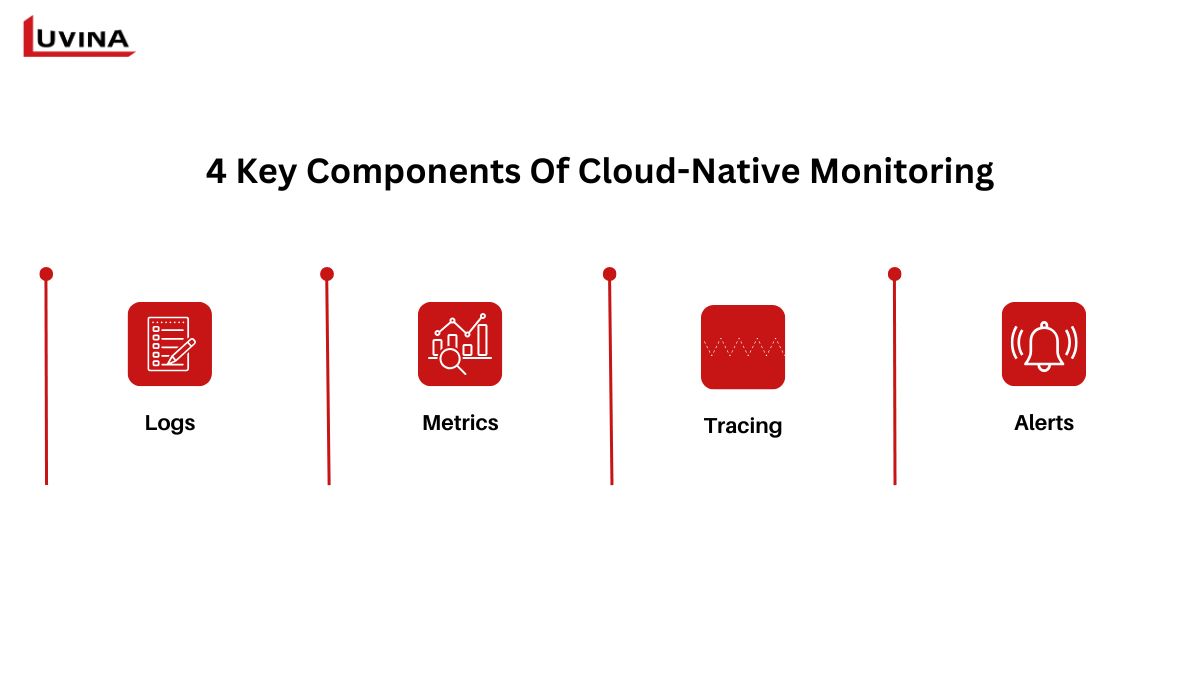
1. Logs
Logs are detailed records of events within your applications and infrastructure, meaning every service or application in your system records events as they occur. Logs are used for troubleshooting, understanding the behavior of systems, and enforcing security. For example, an application will identify and record an error when it happens; the developers can then pinpoint exactly where in the system this has occurred.
2. Metrics
Metrics aggregate values from related, measurable events. Metrics are time-based data measured at frequent intervals, providing insight into event types. It allows you to quantify resource utilization and throughput in addition to overall user experience to make informed decisions, optimize system performance, and plan for future capacity. Cloud-native observability tools will frequently offer metrics such as CPU usage, memory usage, request latency, key site indicators, rate gauges over changes between events in a series, and counters.
3. Tracing
Tracing records-related events and presenting them in a meaningful order. All events in a tracked sequence are linked through a unique ID, which passes from the initial request to subsequent events. This means that if an error occurs, cloud-native application monitoring builds a path from the initial request to the error point. By following the request’s path, you can quickly pinpoint the root cause of issues.
4. Alerts
Alerts are what flag developers regarding impending issues that require resolution. A good monitoring system would have alerts automated for when any of the metrics, logs, or traces demonstrate any threshold or anomaly. It ensures that teams are quickly informed up front of possible incidents or degradation of performance. In Cloud-native monitoring, alerting tools use patterns in log, metric, and trace data to determine anomalies. It will then trigger an alert if anything out of the normal state occurs.
Cloud-native monitoring challenges
Many challenges come with cloud-native monitoring. Some of these include:
- Rapid scalability
One of the big advantages of cloud-native systems, of course, is flexible scalability: size and capacity can be dialed up or down based on demand. But where the flexibility in scaling brings an awful lot of challenges with it is in monitoring: as resources shift, monitoring tools for cloud-native environments have to move fast to keep track of new versions and services and make sure that visibility is not only accurate but also complete, which means not leaving out any parts.
- Large data volumes
Cloud-native applications generate a lot of metrics, logs, and traces. In fact, the volume is such that only advanced cloud-native monitoring tools are capable of sifting through them, highlighting the critical signals, removing noise, and ensuring that nothing crucial gets missed.
- Complex microservices architecture
Microservices architecture breaks applications into smaller, independent services, increasing the number of components and interactions, which complicates cloud-native monitoring. Sometimes, identifying an issue among these independent services can feel like finding a needle in a haystack.
- Visibility across multiple environments
Cloud-native monitoring and performance tracking become extremely challenging when applications are spread across various environments (cloud, on-premises, hybrid). Monitoring this setup is similar to overseeing employees across different offices and locations; you need a clear, holistic view of each person’s work. To integrate all information seamlessly, monitoring cloud-native application tools is essential to avoid missing any crucial information across any environment.
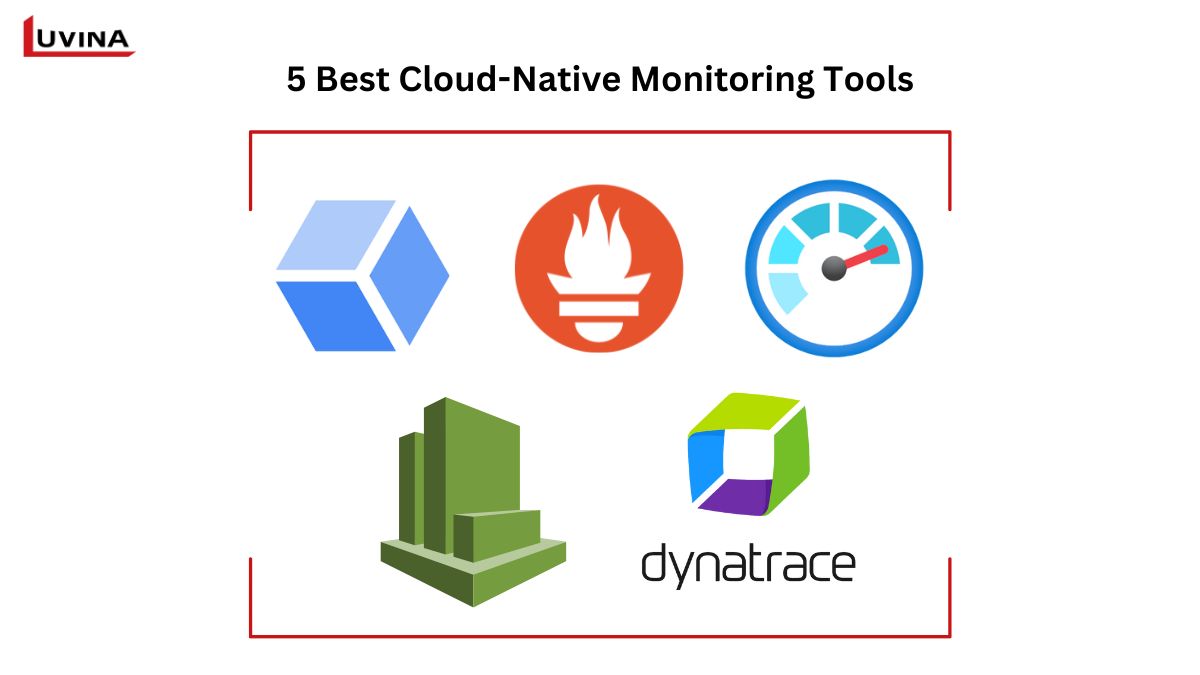
5 Best cloud-native monitoring tools
Cloud-native monitoring can indeed be complex, but the good news is that there are plenty of cloud-native monitoring tools (both native and third-party) available to support you. Below are some cloud-native observability tools we believe can provide comprehensive monitoring for your cloud environment.
1. Google Cloud Operations
Google Cloud Operations, previously called Stackdriver, provides a comprehensive suite for monitoring, logging, and tracing applications and systems across the Google Cloud platform and other environments. Its features include robust, real-time log management and analysis, large-scale metrics observability, a managed service dedicated to Prometheus, and Application Performance Management (APM), which integrates monitoring and troubleshooting to enhance application performance, uptime, and overall system health. These capabilities make it a strong option among cloud-native monitoring tools.
2. Prometheus
Cloud-native application monitoring is well-served by Prometheus, a powerful open-source solution designed for collecting, aggregating, and analyzing metrics data. Known for its dimensional data modeling and efficient data storage, Prometheus offers strong querying capabilities through PromQL and enables precise, flexible alerting. It integrates seamlessly with visualization tools like Grafana, and its client libraries make it easy to instrument applications across varied infrastructures. As the default monitoring tool for Kubernetes deployments, Prometheus provides an accessible yet comprehensive monitoring package for a wide range of applications and resources.
3. Microsoft Azure Monitor
As an Azure native monitoring tool, Microsoft Azure Monitor is a comprehensive solution that enhances visibility and performance across Azure resources and beyond. With capabilities to collect and analyze metrics, logs, and telemetry from both cloud and on-premises systems, Microsoft Azure Monitor supports infrastructure, application, and network monitoring. It integrates seamlessly with analytics and machine learning tools, as well as with Event Hubs and Logic Apps for broader data management.
By aggregating data from various sources, Microsoft Azure Monitor provides insights and automated responses to system events, making it a versatile tool for ensuring the health and availability of applications and services.
4. AWS CloudWatch
AWS native monitoring tools, particularly AWS CloudWatch, provide a robust solution for monitoring and observing metrics, logs, and events throughout your AWS environment. As the primary observability service for AWS, CloudWatch automatically collects data from various services, including S3, EC2, and Kinesis. It features CloudWatch Application Insights, which helps in discovering and monitoring all underlying resources within an AWS account, while CloudWatch Alarm allows users to set custom thresholds for detecting anomalies, such as traffic spikes or latency issues, and triggers predefined actions like auto-scaling.
Despite its strengths, users may find its complex interface challenging to troubleshoot and its pricing model unpredictable, as costs are based on metrics, log volume, and queries. Overall, AWS CloudWatch is a crucial component of cloud-native monitoring, streamlining the management of applications and infrastructure within AWS and beyond.
5. Dynatrace
Dynatrace is an advanced analytics and automation platform enhanced by artificial intelligence, designed to streamline the complexities of cloud environments and facilitate rapid, secure innovation. It provides comprehensive full-stack monitoring with intelligent observability that spans both cloud and hybrid infrastructures. This capability ensures continuous auto-discovery of various components, including hosts, virtual machines, serverless functions, cloud services, containers, Kubernetes, networks, and devices, along with logs and events.
By leveraging these features, Dynatrace enables organizations to maintain robust operational oversight and enhance their cloud performance, making it a vital resource among cloud-native observability tools.
Cloud-native monitoring best practices
To effectively implement cloud-native monitoring, here are some best practices you can refer to:
- Apply distributed tracking
Compared to traditional application environments, cloud architecture is much more complex because it includes distributed systems made up of many moving parts, coming from various teams and written in different languages. Distributed tracing is a monitoring technique very suitable for cloud-native applications. Distributed tracing involves collecting data across all components, acting like a distributed log ledger where each application component adds to the history of a request. Implementing distributed tracing will help you accurately and quickly identify where errors occur and how they spread to end users.
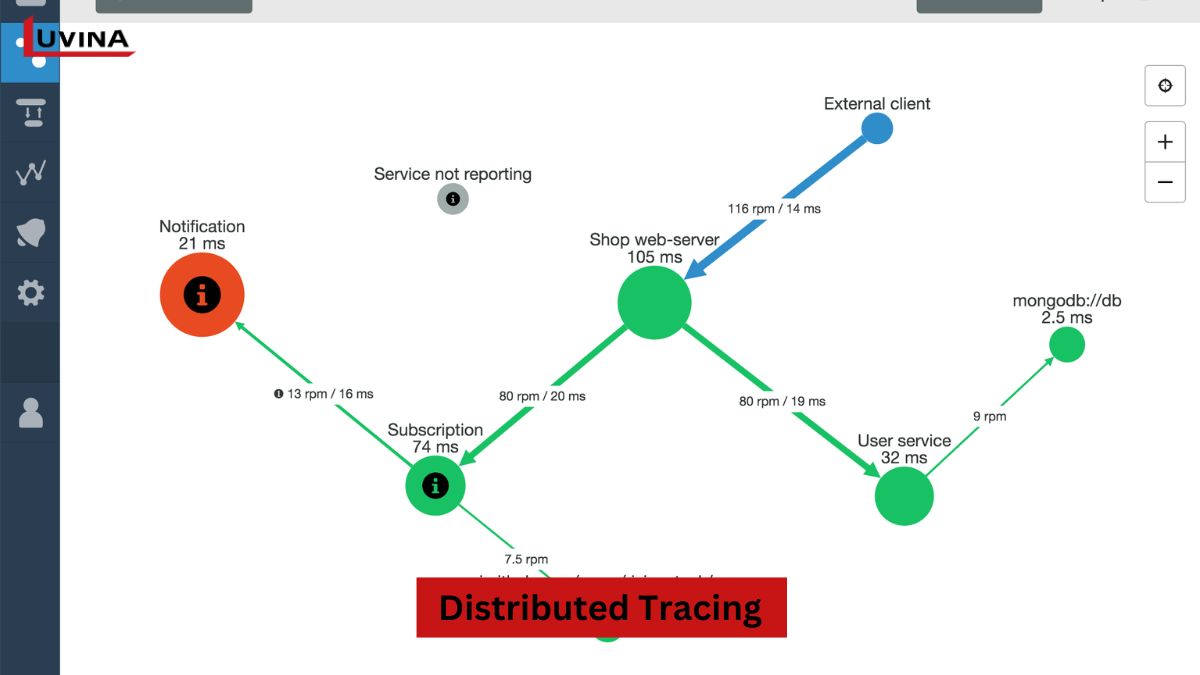
This visibility is extremely valuable for diagnosing problems, identifying errors, and understanding dependency relationships in the cloud-native architecture, thus improving the performance and reliability of the application.
- Leverage automation
To perform Cloud-native monitoring dynamically, automate every possible task. Automation is particularly useful for deployment and establishing baselines, minimizing blind spots, enhancing visibility, and helping you gain more accurate and contextual insights.
Automating the monitoring process in a cloud-native environment not only streamlines incident detection but also improves response speed, reduces human error, and ensures that potential issues are identified and resolved even during business hours. You can apply automation in everything from deploying monitoring agents and collecting metrics to triggering alerts and executing responses.
- Properly configure alerts
Take time to outline the types of alerts to help different teams quickly identify incidents. Properly configuring alerts will help you prevent alert overload and ensure the specificity of alerts, reducing false alerts. An effective alerting strategy will reduce response times for teams to resolve incidents more quickly.
Additionally, you can group alerts based on priority levels, for example, grouping high-risk alerts with low-risk alerts based on their impact on your business. Risk classification and prioritization will be important for you to focus efforts on significant issues, saving time and preventing worst-case damage. Creating different alert groups can also help you easily send alerts to specialized handling teams.
- Create dedicated dashboards
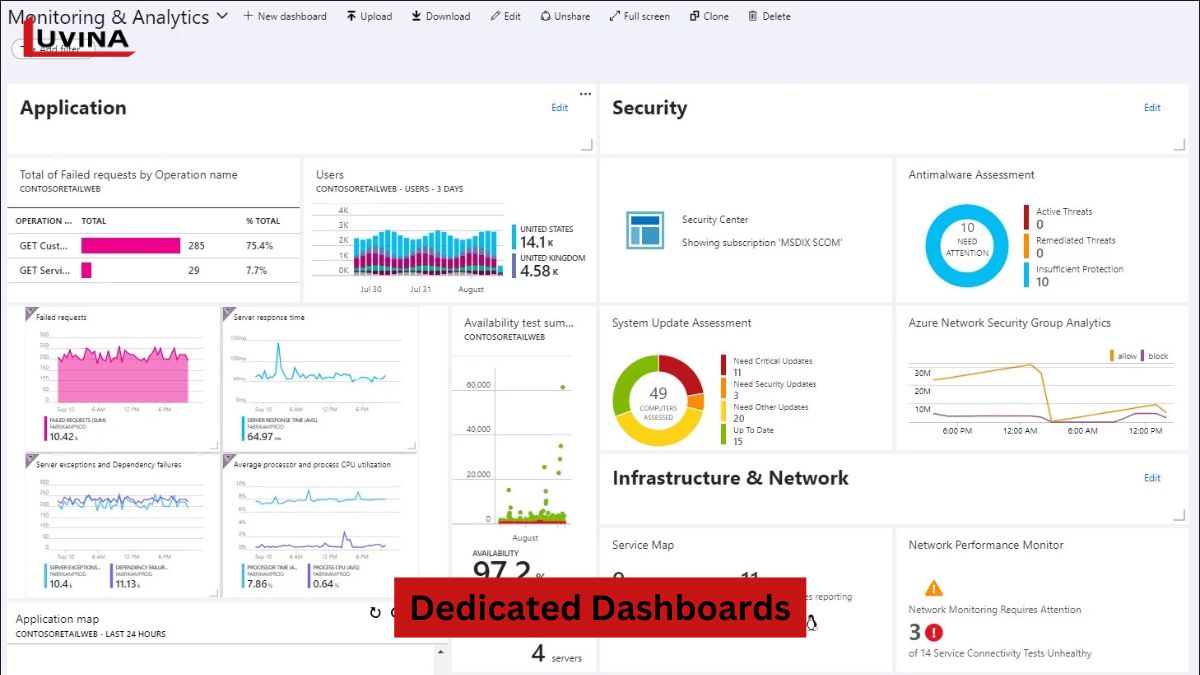
Creating specialized dashboards using cloud-native observability tools is a way to provide specific analysis teams with relevant monitoring data. Specialized dashboards can offer a view of monitoring data and a tailored design for different roles within each team, preventing unrelated members from viewing sensitive data. Specialized information will also help teams assess situations quickly.
- Identify key performance indicators and set service level objectives
When using cloud-native monitoring tools, choosing key performance indicators related to the application and setting service-level objectives for the application will help you assess whether the application is functioning as expected. You will also be able to track uptime, incident response times, usage levels, and application error rates. Most cloud-native applications generate a large amount of data. Therefore, identifying key performance indicators and service level objectives will help you determine which data is essential to avoid noise when performing monitoring.
- Aggregate remote data
If possible, aggregate logs, metrics, etc., into a single system to monitor the behavior of your microservices in the cloud-native architecture. Centralizing this data in one place can help you track resources in real time, shape alert configurations, and identify the causes of incidents.
- Continuously review and adjust
Cloud-native monitoring is an ongoing journey. Therefore, always review your strategies, tools, and configurations. Application needs will always change, especially with cloud-native applications, and you must adapt to these changes and be quick to take advantage of new technologies.
How can Luvina help?
If you are looking for a partner for cloud-native monitoring Luvina will be one of the ideal choices. Luvina’s cloud development services include a variety of custom solutions designed to meet your specific needs. With our solutions, Luvina empowers businesses to unlock the full potential of cloud technology, whether on public, private, or hybrid clouds, ensuring scalability, security, and cost-efficiency.
We support the integration of powerful cloud-native observability tools that help you efficiently manage cloud-native environments with
- – Centralized views
- – Custom dashboards that accelerate issue resolution
- – Automation and simplification of monitoring for execution and compliance audits by tracking every policy change and storing a daily history of compliance status
With over 20 years of experience and a team of more than 750 experts, Luvina is confident in delivering the best quality service for you. Contact us today to receive cloud management solutions tailored just for you.


Read More From Us?
Sign up for our newsletter
Read More From Us?
Sign up for our newsletter